 The Lauren, A Condominium
Annual Meeting Treasurer's Report
June 6, 2006
Treasurer's Report
The graphs distributed summarize the history of the finances of the association. These are updates of the graphs handed out at last year's meeting. The dollar amounts are from the annual audited statements through 2004. 2005 data are from the December monthly statement from the financial management company and are subject to correction.
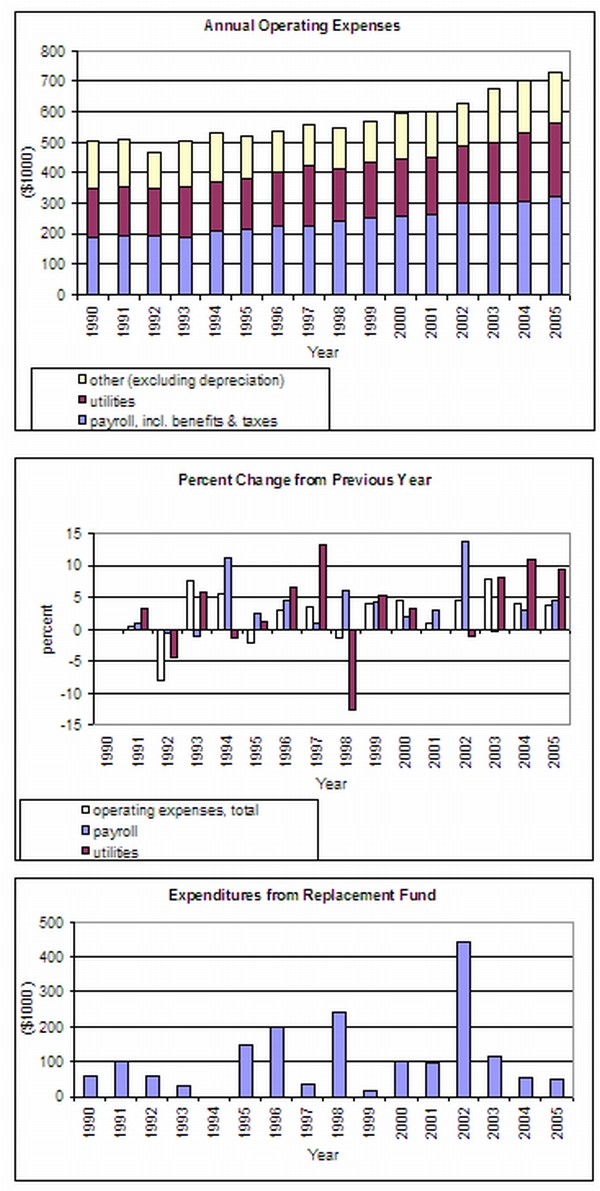
The first graph shows the history of operating expenses since 1990. The three components are labor costs, utilities (gas, electricity, water, and office telephones), and other (i.e., everything else). The second graph shows annual percentage increases in total operating expenses, labor, and utilities. Most noteworthy are the increases in utilities the past several years. Utility bills were up 8 percent in 2003, 11 percent in 2004, and 9 percent in 2005. An even bigger percentage increase is projected in the 2006 budget, although gas rates have declined somewhat recently.
2005 was a second consecutive slow year for capital expenditures (third graph), only about $50,000, mainly related to the HVAC system. Several capital projects contemplated in the 2005 budget (including electrical system upgrading and HVAC work) did not progress as far as had been anticipated or were not begun, and so were carried over to the 2006 budget. The President has described possible upcoming capital expenditures.
The fourth graph shows how the association has been preparing for needed capital expenditures. The graph, labeled "net cash" shows the sum of all our bank account and CD balances, less all amounts currently owed to employees and outside parties. In other words, we could pay all our current bills and have this amount left over. This measure excludes the association's other principal asset (in addition to bank accounts and CDs), which is the Lauren apartment we own. The unit has substantial market value, but is carried on the books at less than $10,000, because its original purchase price has been almost fully depreciated.
This net cash measure rose sharply in 2005 because of the budgeted regular annual contribution and because capital expenditures were below budget.
The fourth graph shows budgeted versus actual operating and capital expenditures. Historically, we have tended to over-budget for operating expenses and under-budget for capital expenditures. The last three years, the operating budget has been reasonably close to actual expenditures. Under-budgeting for capital expenditures occurs because in many years there are unexpected capital expenditures, which are not provided for in the budget.
The increase in utilities expenses raises the question of usage trends. The last two graphs show electricity and gas consumption in the Lauren for various years between 1989 and 2005. Electricity usage has been nearly constant over the period, with a slight upward trend the last few years. The increase in gas usage in the early 1990s reflects the removal of a backup oil burner that was used during peak heating periods in the winter. Gas consumption has been declining a little in recent years.


Respectfully submitted,
Joseph Morris, Treasurer
To receive e-mail copies of Board
minutes, send a request to Property Manager Walter Krolman at
manager@lauren.org Copies of Annual Meeting reports
are posted at www.lauren.org/am_menu.htm
Previous issues of Lauren Board
Other Lauren information may be found in the Business Section of the Lauren
Web site
www.lauren.org/business.htm
TO SUBSCRIBE