 The Lauren, A Condominium
Annual Meeting Treasurer's Report
June 2, 2005
The graphs distributed summarize the history of the finances of the association. These are updates of the graphs handed out at last year's meeting. The dollar amounts are from the annual audited statements through 2003. 2004 data are from the December monthly statement from the financial management company and are subject to correction.
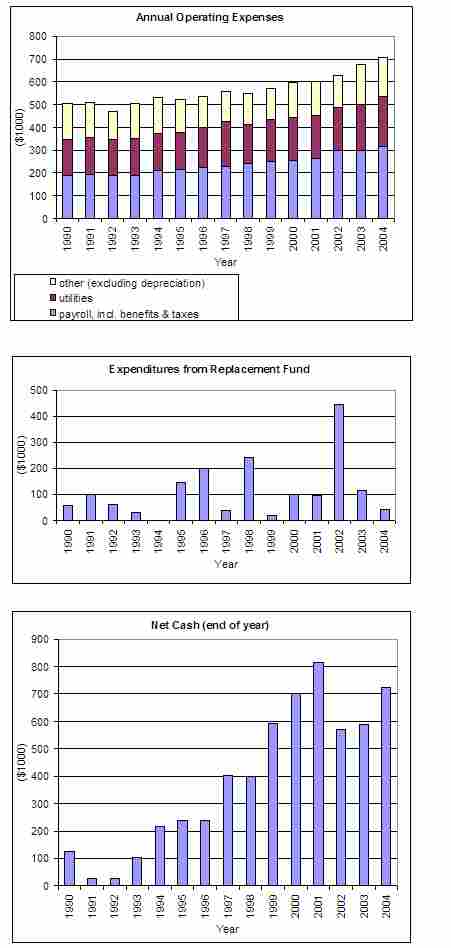
The first graph shows the history of operating expenses since 1990. The three components are labor costs, utilities, and other (i.e., everything else). Both utilities and labor increased sharply last year (roughly 10 percent for utilities and 6 percent for labor). Utilities are up because of energy and water price increases. Labor is up because of salary adjustments, higher insurance premiums, and more hours worked.
2004 was a relatively slow year for capital expenditures (second graph), only $42,000. The only significant project completed was the parking lot fence.
In 2005, capital projects budgeted include improvements to the HVAC system, an electrical wiring analysis (which has not yet been started), and installation of a new intercom and front door buzzer system (also not yet started).
The third graph shows how the association has been preparing for needed capital expenditures. The graph, labeled "net cash" shows the sum of all our bank account and CD balances, less all amounts currently owed to employees and outside parties. In other words, we could pay all our current bills and have this amount left over. This measure excludes the association's other principal asset (in addition to bank accounts and CDs), which is the Lauren apartment we own. The unit has substantial market value, but is carried on the books at nearly zero, because its original purchase price has been almost fully depreciated.
This net cash measure rose in 2004 because of the budgeted regular annual contribution and because capital expenditures were below budget.
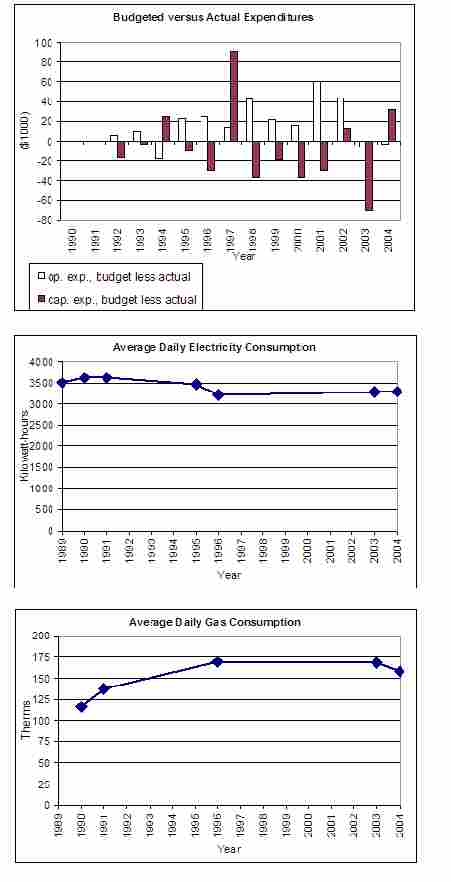
The fourth graph shows budgeted versus actual operating and capital expenditures. Historically, we have tended to over-budget for operating expenses and under-budget for capital expenditures. The last two years, the operating budget has been much closer to reality. Under-budgeting for capital expenditures occurs because we have never included an item for surprises in the capital budget, and most years there are unexpected capital expenditures.
The increase in utilities expenses raises the question of usage trends. The last two graphs show electricity and gas consumption in the Lauren for various years between 1989 and 2004. Electricity usage actually appears to have declined slightly over the period. The trend may reflect weather differences or some conservation measures that have been carried out. The increase in gas usage probably mainly reflects the removal of a backup oil burner that was used during peak heating periods in the winter until the early 1990s. (Oil consumption data were not available.) The only significant trend is that gas consumption for cooking (which is billed separately and is not shown separately on the graphs) has declined by about 40 percent from the level of the early 1990s.
Respectfully submitted,
Joseph Morris, Treasurer
To receive e-mail copies of Board
minutes, send a request to Property Manager Walter Krolman at
manager@lauren.org Copies of Annual Meeting reports
are posted at www.lauren.org/am_menu.htm
Previous issues of Lauren Board
Other Lauren information may be found in the Business Section of the Lauren
Web site
www.lauren.org/business.htm
TO SUBSCRIBE